
How a Tasmanian council built a practical energy transition roadmap for a sporting precinct
The precinct already had rooftop solar, heat-pump hot water, efficient electric systems and modern lighting controls. The next challenge was not finding more technology. It was deciding what to improve next, in what order and at what point in the asset-renewal cycle.
The client, facility and exact location have been withheld. Building names and identifying operational details have been generalised, and selected figures have been rounded. The project scope, analysis and strategic outcomes are real.
The answer upfront
The assessment did not recommend replacing everything at once. It showed that the precinct had already completed much of its transition. The strongest pathway was to finish the remaining gas-to-electric hot-water projects, restore solar monitoring, improve account and load visibility, and coordinate later lighting, kitchen, solar and battery projects with planned asset renewal.
The 20–35% figure is a planning-level estimate for the complete strategy, not a measured saving. Capital ranges are July 2026 estimates excluding GST, reviewed 25 September 2026, and are not supplier quotations.
- ~185 MWh/yr Electricity reviewed
- ~45 kWp Existing solar
- 20–35% Estimated complete-strategy cost reduction
- 3 stages Implementation roadmap
The brief
Tasman Energy Advisory was engaged by a Tasmanian local government to assess a large, multi-building community sporting precinct and develop a practical government energy strategy.
The council needed a strategy that could connect several different decisions:
- How should the remaining gas-fired equipment be replaced?
- Which existing energy assets should be repaired, retained or expanded?
- When would solar, battery storage and intelligent controls become worthwhile?
- What enabling electrical work would be required?
- How should the projects be sequenced alongside normal capital works and asset renewal?
The objective was not to produce a shopping list. It was to give decision-makers a defensible council electrification strategy for planning, budgeting, funding applications and future project development.
The 20–35% figure in the summary above is a planning-level estimate for implementation of the complete strategy. It is not a measured saving, a guaranteed outcome or the expected return from any individual project.
The precinct at a glance
| Item | De-identified project details |
|---|---|
| Client | Tasmanian local government |
| Facility | Large, multi-building community sporting precinct |
| Operations | Administration, training, competition, venue hire and major events |
| Major energy uses | Sports lighting, amenities, commercial kitchens, refrigeration, hot water, heating and general building services |
| Existing renewable energy | Approximately 45 kWp of rooftop solar |
| Energy data | Electricity bills, 15-minute interval data, gas consumption and historical solar monitoring |
| Other evidence | Site inspections, asset information, operating requirements and previous upgrade history |
| Deliverable | Prioritised energy transition and electrification roadmap |
The electricity total represents the council-managed accounts available for review. Additional supplies associated with parts of the precinct sat outside those accounts, so the available data did not represent every load at the facility.
A substantial part of the transition had already happened
The site was not starting from zero. Previous investment had already introduced:
- rooftop solar;
- commercial heat-pump and electric-storage hot-water systems;
- progressively upgraded LED lighting;
- intelligent sports-lighting controls;
- reverse-cycle heating and cooling in refurbished areas; and
- a newer all-electric building.
This changed the nature of the assignment. The best strategy was not to discard serviceable assets or repeat work that had already been done. It was to build on the existing foundation and close the remaining gaps.
What the data and site inspection showed
1. Energy demand changed dramatically with events
The precinct combined relatively steady daytime loads, such as administration, refrigeration and amenities, with large, intermittent evening loads from training, competition, lighting, kitchens and events.
That profile created opportunities for more solar and future battery storage, but it also meant that annual totals alone were not enough. Interval data was needed to understand when demand occurred and which projects could change it.
2. The existing solar asset was valuable, but its monitoring needed attention
The approximately 45 kWp solar system had historically generated around 60 MWh per year. The available data suggested that about half of its output was being used within the reviewed accounts, with the balance exported.
However, the historical monitoring platform had stopped recording. The first solar recommendation was therefore not immediate expansion. It was to verify system performance and restore monitoring so future design decisions could begin with a reliable baseline.
3. Most fixed gas use had already been removed
The remaining reticulated natural-gas consumption was approximately 9.7 GJ per year, equivalent to about 0.5 tonnes of direct Scope 1 emissions using the greenhouse factors applied in the assessment.
That relatively small figure was evidence of prior progress. Remaining gas use was concentrated in a limited number of hot-water and commercial-kitchen assets.
The strategic case for completing electrification was therefore broader than a large short-term emissions saving. It included:
- replacing ageing infrastructure;
- eventually removing the fixed gas connection;
- reducing duplicated services and maintenance requirements;
- standardising the precinct around electric systems; and
- creating more daytime electrical demand that could be matched with solar.
4. Some equipment changes depended on electrical infrastructure first
Electrifying one commercial kitchen would require a material electrical-supply upgrade. Recommending new electric appliances without identifying that dependency would have understated cost, risk and delivery time.
This was an important part of the assessment: each technology option was considered together with the infrastructure needed to make it work.
The recommended order of work
The strategy separated actions into three delivery horizons. The roadmap was designed as a planning framework, not a fixed construction program. Timing should continue to respond to asset condition, operational needs, available funding and future capital works.
Immediate priorities: 0–2 years
| Priority action | Why it came first |
|---|---|
| Replace the remaining gas-fired hot-water systems | Removes the largest remaining fixed gas load and improves hot-water efficiency |
| Verify solar performance and restore monitoring | Establishes a reliable baseline before expansion or battery sizing |
| Review electricity-account ownership and procurement | Improves visibility, simplifies management and may strengthen purchasing outcomes |
| Continue replacing legacy internal lighting with LED | Reduces consumption and maintenance through normal renewal |
Medium-term priorities: 2–5 years
| Priority action | Delivery consideration |
|---|---|
| Electrify the remaining commercial kitchens | Coordinate with refurbishment and electrical-capacity upgrades |
| Replace resistance heating where appropriate | Prioritise regularly occupied areas and confirm equipment sizing |
| Replace ageing refrigeration equipment | Align with asset condition and end-of-life replacement |
| Expand rooftop solar | Complete structural, electrical and network assessment first |
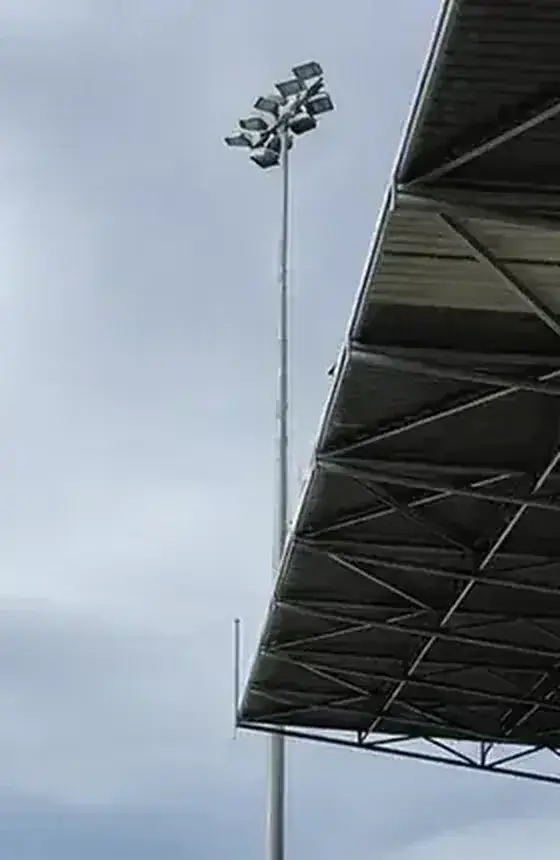
| Upgrade sports lighting to LED | Retain valuable towers and controls where practical |
Longer-term priorities: 5+ years
| Priority action | Why it was deferred |
|---|---|
| Install battery energy storage | Size it after priority electrification and solar expansion define the future load profile |
| Add integrated energy management | Coordinate solar, storage, hot water, lighting and other major loads once the core assets are in place |
| Continue electrification through normal renewal | Avoid premature replacement while maintaining the direction towards an all-electric precinct |
Planning-level capital requirements
The assessment developed indicative July 2026 capital ranges for the parts of the gas-to-electric transition that were sufficiently defined.
| Project group | Planning-level capital cost, excluding GST |
|---|---|
| Remaining hot-water electrification | $78,000–$102,000 |
| Remaining commercial-kitchen equipment electrification | $60,000–$85,000 |
| Total defined gas-to-electric equipment projects | $138,000–$187,000 |
| Separate electrical-supply upgrade for one kitchen | At least $35,000 |
The separate electrical-supply allowance was not included in the $138,000–$187,000 equipment-project total.
These were strategic planning allowances, not contractor quotations. They were intended to support budgeting and funding decisions before detailed design and competitive procurement. Major switchboard or network upgrades, structural work, broader refurbishments, detailed design, authority fees and contingency were excluded unless specifically noted.
Why a battery was not the first project
The precinct had several characteristics that could eventually support commercial battery storage:
- existing solar generation;
- excess daytime renewable energy;
- substantial evening activity;
- high-resolution interval metering; and
- a future increase in electrical demand as gas equipment is replaced.
However, the future load profile was still changing. Solar performance first needed to be verified, the priority electrification projects completed and future solar expansion defined.
Specifying a battery too early risked sizing it against yesterday’s loads instead of the future precinct. Battery storage was therefore retained as a logical later-stage project, to be assessed for renewable-energy utilisation, evening demand, resilience and financial value once the preceding decisions were clearer.
This is the same principle that applies at smaller properties: storage should be sized around the paid grid energy and load profile that remain after more fundamental decisions have been made. See the related case study, Would a home battery pay for itself?
Expected impact of the complete strategy
| Measure | Planning-level outcome |
|---|---|
| Energy operating costs | Estimated reduction of approximately 20–35% after implementation of the complete strategy |
| Fixed natural-gas use | Near elimination following completion of the gas-to-electric projects |
| Direct gas emissions | Approximately 0.5 t CO₂-e per year removed, based on the consumption reviewed |
| Renewable-energy use | Increased through solar expansion, future storage and coordinated loads |
| Asset performance | Improved through planned renewal, monitoring and standardisation |
| Community outcome | More reliable, efficient and resilient infrastructure for sport and events |
The full financial and energy outcome will depend on final design, equipment selection, tariffs, operating hours, venue use, solar expansion and any future battery capacity. The assessment did not assign the complete benefit to a single project or present the estimate as guaranteed savings.
The important government lesson: sequence matters
For a complex public asset, the technically possible project is not always the right project to deliver first.
Replacing serviceable equipment early can destroy remaining asset value and compete with higher-priority capital needs. Waiting without a plan can also lock in gas, inefficient equipment or undersized electrical infrastructure.
The stronger approach was to connect the energy strategy with the council’s asset-management plan and capital-works program. This allowed the organisation to:
- act first on clear, high-priority issues;
- coordinate enabling infrastructure with equipment replacement;
- avoid stranded or prematurely replaced assets;
- minimise disruption to community operations;
- prepare stronger budgets and funding applications; and
- revisit later-stage projects using better data.
Lessons for other councils and government asset owners
- Start with the assets, data and operating requirements, not a preferred product.
- Recognise previous investment before proposing new capital expenditure.
- Treat missing monitoring as a decision-quality problem worth fixing.
- Identify electrical, structural and network dependencies before costing electrification.
- Separate immediate actions from projects that depend on the future load profile.
- Align electrification with asset condition and normal replacement timing.
- Use planning estimates for strategic decisions, then confirm projects through design and procurement.
- Evaluate resilience, maintenance, service quality and whole-of-life value alongside simple payback.
Final outcome
The council received a three-stage roadmap that connected energy data, existing assets, operational constraints, capital costs and long-term sustainability objectives.
The value of the work was not a recommendation to purchase the largest possible solar array or battery. It was a clearer decision sequence:
Measure what is working, complete the remaining priority electrification, coordinate projects with asset renewal, then expand renewable energy and storage against the future—not the past—load profile.
Planning an energy transition across a public facility or asset portfolio?
Tasman Energy Advisory provides independent, engineering-led advice for councils, government agencies and organisations managing complex facilities.
The work can connect energy data, asset condition, electrical capacity, costs, emissions and organisational objectives into a practical roadmap for planning, funding and implementation. Explore government and electrification strategies.
No equipment sales. No commissions or referral payments. Independent advice based on the organisation’s assets, data and operating requirements.