
Would a home battery pay for itself? A real Hobart case study
A large solar system, two electric vehicles and growing winter heating demand looked like the perfect case for a home battery. After analysing 300 days of meter and inverter data, the financial case was much weaker than expected.
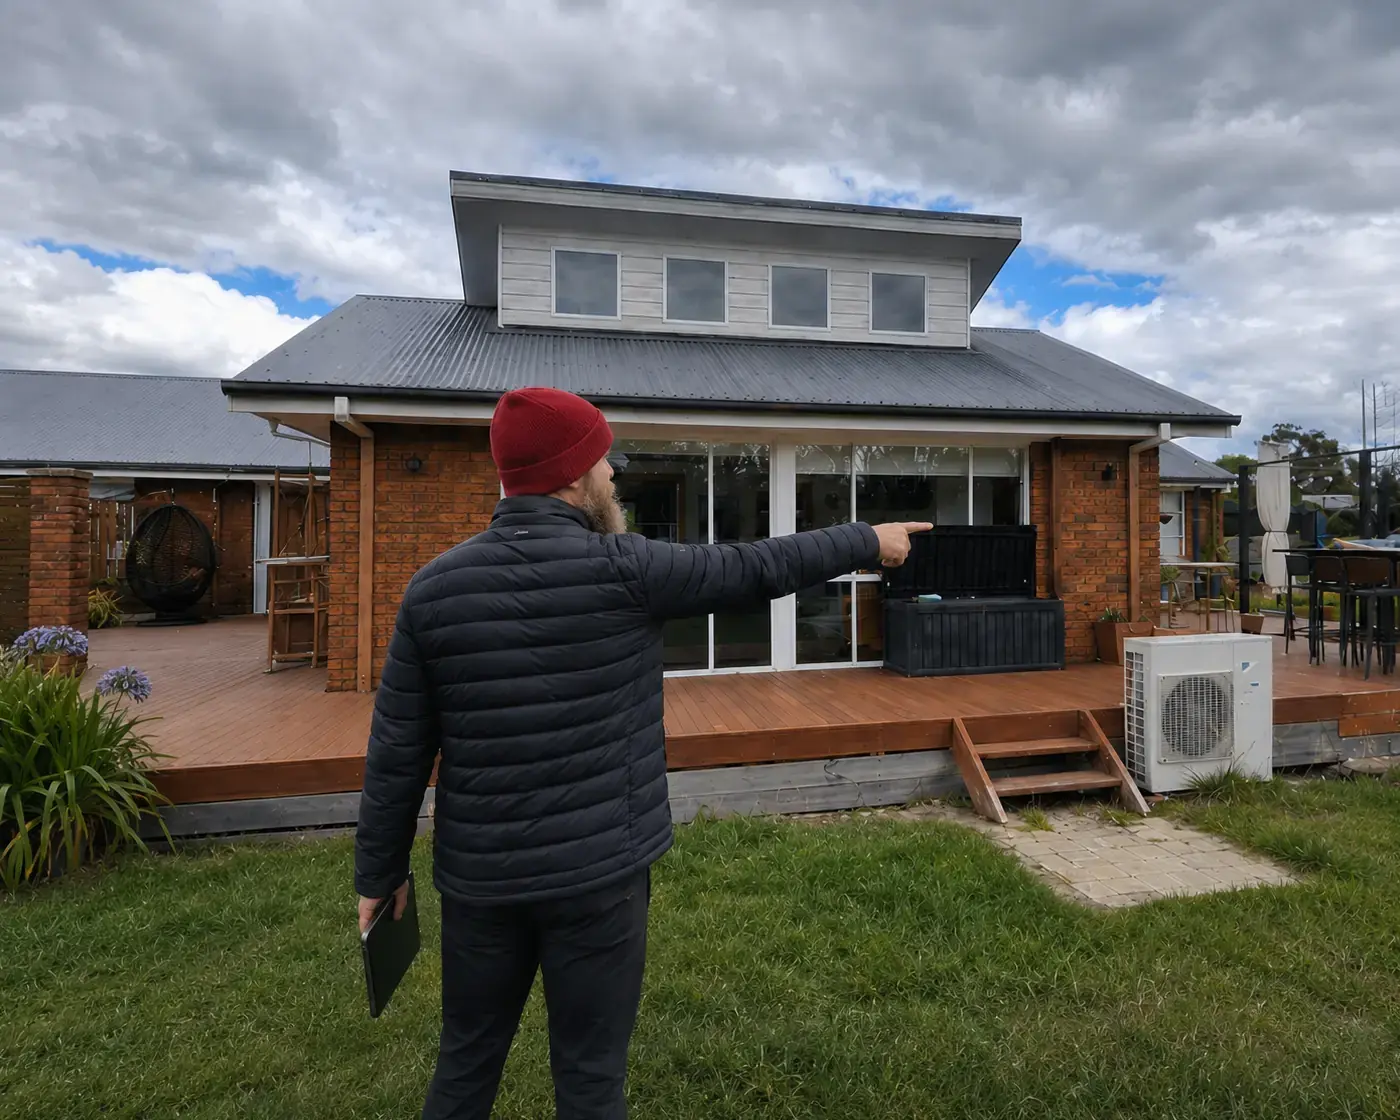
For this case study, Tasman Energy Advisory founder Jarred Nielson analysed his own Greater Hobart home. The exact address has been withheld, but the energy data, tariff assumptions and modelling results are real.
The answer upfront
A battery would reduce the bill, but it would not be a strong financial investment at current prices. A 10 kWh battery captured nearly all the available value, yet its estimated simple payback was about 23 years at the current post-rebate market average. Solar remained the stronger investment, with an illustrative payback of about 7 to 11 years if the existing system were purchased today.
All prices and incentives in this case study are current as at 18 September 2026.
- 13.2 kW Solar array
- 69% Solar exported
- 10 kWh Practical battery ceiling
- 23 years Modelled battery payback
The question
The home already had a large solar system. It exported a great deal of electricity during the day but still imported power in the morning, evening and through winter.
That raised three reasonable questions:
- Would a battery meaningfully reduce the electricity bill?
- What battery size would capture most of the available saving?
- Would other upgrades provide better value first?
The objective was not to maximise self-sufficiency at any cost. It was to find the option that delivered the best practical and financial outcome for the household.
The home at a glance
| Item | Details |
|---|---|
| Location | Greater Hobart, Tasmania |
| Electricity supply | Single phase, 63 A main switch |
| Solar panels | 13.2 kW |
| Solar inverter | 10 kW |
| Electric vehicles | Two, normally charging at 2.5 to 3.5 kW |
| Hot water | Storage cylinder with a 3.5 kW resistance element |
| Heating | Four reverse-cycle heat pumps, including the main living-room system |
| Data reviewed | 300 complete days of five-minute meter data, inverter production and bills |
| Matched period | 12 November 2025 to 7 September 2026 |
The heat-pump figures are equipment output ratings, not continuous electrical demand. The home generally used heating selectively, often in one bedroom overnight. The modelling also tested more frequent use of the main living-room heat pump on winter mornings and evenings.
What the data showed
During the matched 300-day period, the solar system generated 11,419 kWh.
| Energy flow | Actual result |
|---|---|
| Solar generated | 11,419 kWh |
| Solar used directly in the home | 3,493 kWh |
| Solar exported | 7,925 kWh |
| Electricity imported from the grid | 3,164 kWh |
| Total household electricity use | 6,657 kWh |
Two different percentages explain the result:
- The household used 31% of its solar generation directly and exported 69%.
- Solar still supplied 52% of the home’s total electricity use, while the grid supplied 48%.
The large export total made a battery look attractive. However, export volume alone does not determine battery value. The battery also needs enough paid demand later in the day to discharge, followed by enough solar or low-cost grid energy to recharge.
Where the solar went
31% of solar generation was used directly at home and 69% was exported. Solar still supplied 52% of household electricity; the grid supplied 48%.
Solar generation
- Used directly at home, 31%
- Exported, 69%
Home electricity supply
- Supplied directly by solar, 52%
- Supplied by grid, 48%
The seasonal mismatch mattered
The annual totals hid a strong seasonal difference.
| Average per day | Summer | Winter |
|---|---|---|
| Grid imports | 4.9 kWh | 22.6 kWh |
| Solar exports | 47.3 kWh | 5.6 kWh |
In summer, the home exported far more solar energy than a normal household battery could store. In winter, when heating increased the need for electricity, there was much less excess solar available.
This is a common misunderstanding: a battery moves energy from one time of day to another. It does not move abundant summer solar into winter.
Summer surplus versus winter demand
In summer the home imported 4.9 kWh and exported 47.3 kWh per day on average. In winter it imported 22.6 kWh and exported 5.6 kWh per day.
Average kWh per day
Summer
Winter
- Grid imports, kWh per day
- Solar exports, kWh per day
Allowing for more winter heating
The household wanted the option to use the main living-room heat pump more often on winter mornings and evenings.
The central modelling scenario added an average electrical load of 1.5 kW for six hours per day from May to August. This added approximately:
- 1,107 kWh per year of electricity use
- $317 per year to the estimated bill without a battery
- a projected annual bill of approximately $827 before battery savings
The extra load improved the potential use of a battery, but only slightly. Much of the new demand occurred during the least solar-rich part of the year. A bigger winter load is not automatically a reason to buy a bigger battery if the battery cannot be filled cheaply and used fully on most days.
How the battery was modelled
The battery model allowed charging from both surplus solar and lower-cost off-peak grid power. It included:
- the household’s five-minute import and export data
- matched inverter production data
- current Aurora Tariff 93 rates from 1 July 2026
- increased winter heating demand
- approximately 90% battery round-trip efficiency
- the feed-in credit lost when exported solar was stored instead
- the current federal battery incentive
- an indicative battery-plus-inverter installed price
The model did not include a value for blackout backup, participation in a virtual power plant, financing costs, maintenance, degradation or future equipment replacement. Those items should be assessed separately for a real purchase decision.
Current incentives included in the figures
Eligible home batteries can receive federal small-scale technology certificates under the Cheaper Home Batteries Program.
For installations from May to December 2026, the factor is 6.8 certificates per usable kWh. Support applies at:
- 100% of the factor for the first 14 kWh
- 60% between 14 and 28 kWh
- 15% between 28 and 50 kWh
The estimated discount below assumes a net certificate value of $38 per STC. The exact value shown on an installer quote can differ.
Tasmania does not currently add a separate household solar or battery rebate. The former Tasmanian Energy Saver Loan Scheme closed to new applications on 1 September 2025.
Eligible solar PV and heat-pump hot-water systems can also receive federal STCs. Heat-pump hot-water certificate values depend on the approved product and installation details, so no generic rebate amount has been assumed for that upgrade.
Battery size, savings and payback
The financial result flattened quickly once the battery reached about 8 to 10 kWh.
| Usable battery | Estimated annual bill saving | Approx. federal discount | Indicative net installed cost | Simple payback |
|---|---|---|---|---|
| 5 kWh | $272 | $1,300 | $4,500 | 17 years |
| 8 kWh | $332 | $2,100 | $6,800 | 20 years |
| 10 kWh | $356 | $2,600 | $8,300 | 23 years |
| 13.5 kWh | $368 | $3,500 | $10,900 | 30 years |
| 20 kWh | $372 | $4,500 | $15,800 | 42 years |
These installed costs are rounded 2026 market estimates after the federal incentive, installation and GST. The 10 kWh and 20 kWh figures are anchored to August 2026 national battery-plus-inverter market averages. Actual Tasmanian quotes can change with product choice, backup hardware, switchboard work, installation difficulty and inverter compatibility.
Why 10 kWh was the practical ceiling
A 10 kWh battery produced an estimated saving of $356 per year. Doubling the battery to 20 kWh increased the annual saving by only $16.
The larger battery had more capacity but rarely had enough additional high-value work to do. Its simple payback increased to about 42 years.
At a broader 10 kWh installed quote range of $7,500 to $12,000, simple payback was approximately 21 to 34 years. That remains longer than a typical 10-year battery warranty.
10 kWh is the point where modelled savings flattened. It is not a recommendation to buy a battery.
Battery payback by usable capacity
Simple payback rose from 17 years at 5 kWh to 23 years at 10 kWh and 42 years at 20 kWh. 10 kWh is the modelled practical ceiling, not a purchase recommendation.
Simple payback, years
Simple payback is not the same as warranty life or guaranteed return. It divides today’s net installed cost by the first-year saving and excludes finance, degradation, maintenance and replacement.
Incentives and market prices checked 18 September 2026. The federal battery STC factor changes again from 1 January 2027.
Solar and battery returns were very different
The existing solar system’s original purchase price was not available, so the comparison below asks what the same system might look like if purchased in 2026.
| Measure | 13.2 kW solar | 10 kWh battery |
|---|---|---|
| Estimated annual value | $1,600 to $1,800 | $356 |
| Illustrative net installed cost | $12,000 to $18,000 | About $8,300 |
| Federal support included | About $3,000 | About $2,600 |
| Simple payback | 7 to 11 years | About 23 years |
The solar estimate uses the household’s actual direct solar use and exports, current electricity rates and the current feed-in tariff. It assumes approximately 78 solar STCs for a new 13.2 kW Hobart installation in 2026.
The comparison shows why a rebate should not be mistaken for an investment case. Both technologies receive federal support, but the amount of useful work each system can perform is more important than the headline discount.
What if Tasmania received three free hours of electricity?
The Australian Government’s Solar Sharer Offer provides eligible households in New South Wales, South Australia and South East Queensland with three free hours of electricity in the middle of the day. Tasmania is not currently included, although the Australian Government is working with non-Default Market Offer jurisdictions on possible expansion.
The case study tested an optimistic Tasmanian version that retained the current Aurora rates outside the free period.
| 10 kWh battery scenario | Annual saving | Payback at $8,300 net cost |
|---|---|---|
| Current tariff | $356 | About 23 years |
| Hypothetical three free hours | $465 | About 18 years |
Across the wider $7,500 to $12,000 quote range, the free-power scenario produced a simple payback of approximately 16 to 26 years.
Free electricity would improve the result, but the first priority should still be to use it directly. EV charging, hot water, preheating, cooling and appliances can often be shifted into the free period without buying a battery. A battery should store only the free energy that cannot be used directly.
Any future offer would also need to be assessed as a complete tariff. Higher prices or supply charges outside the free period could reduce or remove the apparent benefit.
Better uses of the money came first
The analysis produced a practical order of work.
1. Measure the household before buying equipment
Bills show how much energy was purchased. Interval data shows when it was purchased. Solar production and export data show whether the problem is insufficient generation, poor timing or both.
2. Shift flexible loads
The home’s two EVs, storage hot water and some heating or cooling can be moved into solar-rich or lower-cost periods. Controls and timers are much cheaper than battery capacity.
3. Reduce the heating demand
Insulation, draught sealing and sensible temperature control reduce the amount of energy required every winter. Unlike a battery, these measures can also improve comfort.
4. Replace major equipment when it is due
A heat-pump hot-water system can use much less electricity than a resistance element and may receive federal STCs. However, replacing a functioning cylinder early is not always the best financial choice, particularly when the existing system already heats during the solar period. Product condition, hot-water use and timing should be assessed first.
5. Review the tariff
The value of storage depends on the difference between the charging cost and the electricity price avoided later. A tariff change can alter the result without changing any equipment.
6. Size solar, then size the battery
Solar should reflect the home’s current and future loads, suitable roof area, shading, export limits and expected time in the property. A battery should then be sized against the paid grid energy left after cheaper actions have been taken.
Recommendation for this home
If the objective is financial return
Do not install a battery yet.
Use solar and off-peak periods more effectively, automate EV and hot-water timing, improve winter efficiency and review the tariff. Reassess a battery when prices, tariffs, household demand or available programs materially change.
If backup power or energy independence is important
Obtain detailed quotes for a battery of about 8 to 10 kWh usable capacity. Treat the cost of backup hardware and the non-financial value of resilience separately from bill savings.
Do not assume a 13.5 or 20 kWh battery is better simply because the solar system is large. In this case, extra capacity produced almost no additional annual saving.
Lessons for other homeowners
- A large export total does not automatically justify a large battery.
- Winter demand and summer solar surplus occur at different times of year.
- Battery value depends on how often it can charge and discharge, not just its capacity.
- A federal discount reduces the purchase price but does not guarantee a short payback.
- Flexible loads can often use cheap or solar electricity without a battery.
- Solar and batteries should be assessed separately. They can have very different returns at the same home.
- Backup, comfort and independence are valid benefits, but they should not be presented as bill savings.
- The right battery size is based on paid grid use that remains after cheaper changes, not on the size of the solar array alone.
Final outcome
The home looked like a natural battery candidate: 13.2 kW of solar, two EVs, electric hot water and growing heating demand.
The interval data showed that a battery would work technically but not especially hard financially. A 10 kWh unit captured nearly all the available bill saving, while larger batteries added cost much faster than they added value.
The result was not “batteries are bad”. It was more useful:
Solar was already doing valuable work. The next dollar was better spent on control, timing, efficiency and future equipment replacement before adding battery storage.
Considering solar or a home battery?
Equipment quotes usually begin with a product. An independent home energy assessment begins with the house, the people, the tariff and the data.
Tasman Energy Advisory can review your electricity bills, interval data, solar production, future loads and upgrade options before you commit to a system.
No commissions. No referral payments. Independent advice based on how your home actually uses energy.